Market transparency based on real transactions.
Every PINPOOLS benchmark is a median price calculated from real, anonymized buyer-supplier transactions — not surveys, not third-party reports.
Benchmarks that don't hold up in a negotiation.
Benchmarks built from real transactions.
What buyers get out of it.
Five outcomes procurement teams see when benchmarks stop being reports and start being live data inside sourcing.
Discover overpriced items — fast.
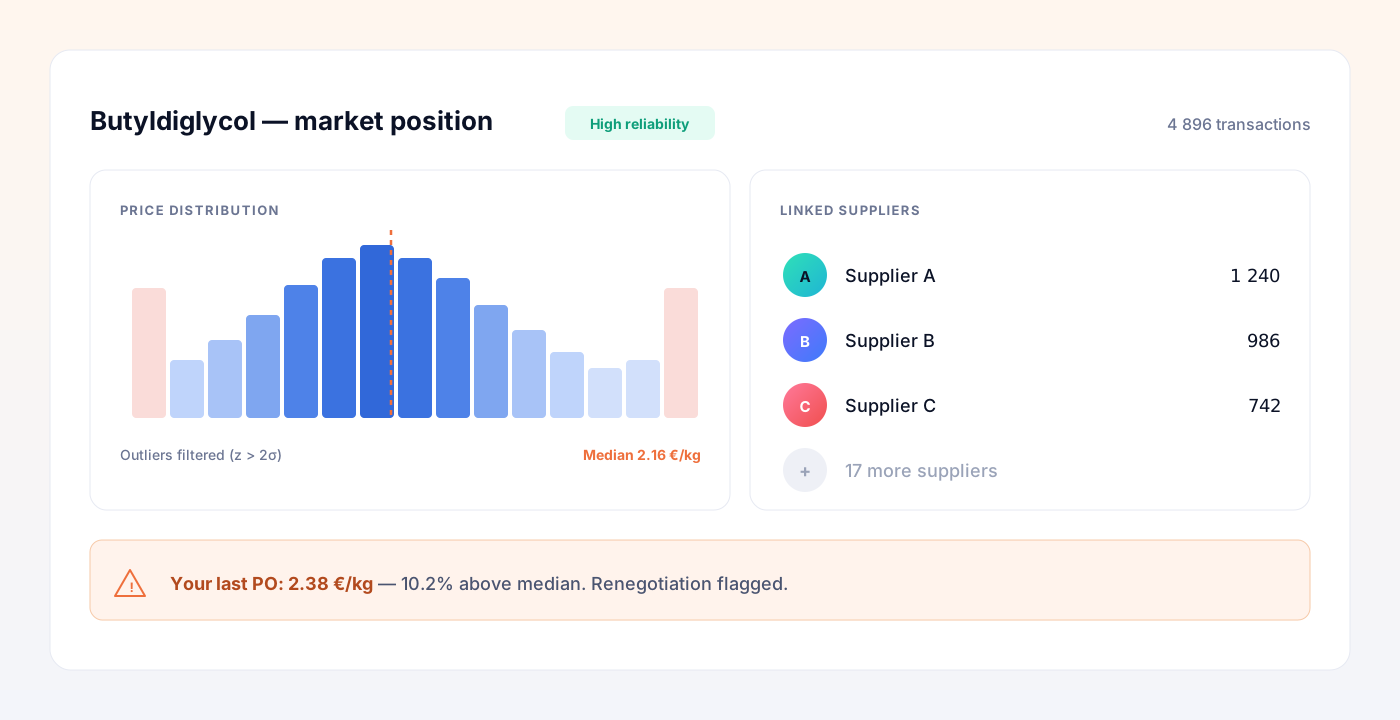
Compare current purchase prices against transaction-based benchmarks. Items that deviate from market surface immediately, and you know exactly what to re-tender.
Gain true market transparency
Every benchmark shows the number of transactions behind it and a reliability score — you always know the confidence you're negotiating on.
Support negotiations with facts
Bring a live median with real deal counts to the meeting. Anecdotes from suppliers stop being the strongest argument in the room.
Integrate benchmarks in sourcing
Benchmarks slot directly into RFX processes, Series Requests, and should-cost models — a live market reference during quoting and analysis.
Base savings on real market data
Report savings against anonymized transaction data — a reference that stands up in audit, not a survey number pulled from a PDF.
What lives under the hood.
The mechanics that turn thousands of anonymized deals into a benchmark you can defend.
Real transaction-based data
Every benchmark is calculated from anonymized buyer-supplier deals on the platform. No surveys, no third-party reports.
Robust z-score outlier filtering
Statistical filtering removes extreme outliers before the median is calculated — benchmarks stay tight, not skewed by tail deals.
Integration into RFX & models
Live benchmarks embed directly into RFX processes, Series Requests, and should-cost models — a market reference during quoting and analysis.
Visualized price history
Interactive time-series chart with filters for quantity, country of origin, place of delivery, producer, packaging, and quality.
Automated supplier linking
Each benchmark exposes the suppliers whose offers fed the calculation — trace the number back to sources without leaving the platform.
3- and 6-month forecasts
The Forecasts & News panel adds market drivers, Force Majeure and planned shutdowns, plus 3- and 6-month outlooks per material.
Two ways in — deep dive for one material, or bulk view across your list.
Use the Benchmarks tab for detailed insight on one or two materials. Use Spend Mapping for a general view across many products at once.
Find your material.
Enter a product name or CAS number in the Benchmarks tab. Pick the exact material from the search results — matching benchmarks appear with their reliability score.
Open the material profile.
See the reliability score (based on the number of processed transactions), the price history chart, and every filter available — quantity, origin, delivery, producer, packaging, quality. Add to Favourites for one-click access next time.
Read Forecasts & News.
Each material profile carries 3- and 6-month forecasts with a detailed explanation — plus intro, market reactions, conclusions, Force Majeure and planned shutdowns, and the data source with URL.
Bulk view via Spend Mapping.
Have many products at once? Go to Create Request → Spend Mapping. Select or paste in a list of materials and the system returns the median price, the number of benchmarks available, and the suppliers whose offers were included in the calculation.
Real transactions become savings customers can defend.
The transparency of real transaction data — rather than surveys or third-party reports — gives procurement teams the confidence to challenge supplier pricing. Many organizations embed these benchmarks directly into RFX processes and should-cost models, enabling continuous competitiveness measurement, internal visibility, and savings reporting with full auditability.
“For the first time, we started every price conversation with a median from real deals — not a survey number. The suppliers noticed.”
Procurement teams in chemicals, pharma, and coatings
benchmark on PINPOOLS.
Benchmarking questions, answered.
Where do PINPOOLS benchmarks come from?
They are calculated from real transactions on the platform — not surveys or third-party reports. Anonymized data from buyer-supplier deals feeds the benchmark for each material.
How is data quality maintained?
Benchmarks use robust z-score outlier filtering, and each material carries a reliability score (High / Moderate / Low) based on the number of processed transactions.
How do I find a benchmark for a specific material?
Enter the product name or CAS number in the Benchmarks tab, select the material from the results, and open its profile.
Can I check many materials at once?
Yes — use Create Request → Spend Mapping to see median prices and available benchmarks for a full list of products.
Can benchmarks be embedded into RFX or Series Requests?
Yes. Benchmarks integrate directly into RFX processes, Series Requests, and should-cost models — giving buyers a live market reference during quoting and analysis.
Do I get forecasts alongside benchmarks?
Yes. The Benchmarks tab includes a Forecasts & News section per material with 3- and 6-month forecasts, source data, and context on market drivers.
Stop guessing the market. Read it.
See live benchmarks for your own materials in a 30-minute demo — with your CAS numbers, on your data.
Trusted by industry leaders · No commitment · Onboarding in days